
In an earlier post we have covered how important it is for SaaS companies to get their metrics right if they want to grow sustainably and attain profitability.
We have also talked about how to determine product market fit, a large part of which has to do with zeroing in on the right metrics and doing the math.
Now what?
First of all, let’s look at what differentiates a SaaS subscription model from a regular business model. Instead of one sale, as in the former, in the SaaS model you have two sales:
1) The initial conversion of a prospect to a free user to a paid user (Acquisition)
2) Retaining the user for as long as possible (retention)
Both these sales need different kind of strategies and tactics: while the former is not very different from traditional businesses the latter is directly proportional to customer success.
For a profitable SaaS business you have to slash down the costs of customer acquisition as much as possible while increasing the average life time value of a user.
The weirdness of the SaaS subscription model
Because of how the SaaS model is structured high growth SaaS companies, unlike traditional businesses might actually be operating at a loss.
Assume that you spend $3000 to acquire a user who pays $500 per month.
Here’s what your cumulative cash flow will look like
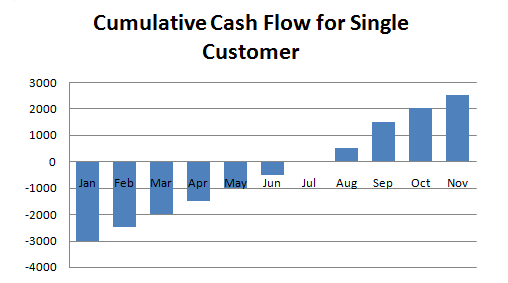
If your customer signs on in Jan it won’t be until Jul that you will break even.
If at any point before Jul the customer quits you are in trouble as you have lost money off her.
Imagine what happens when you have two such customers? You will get deeper into debt before turning cash flow positive
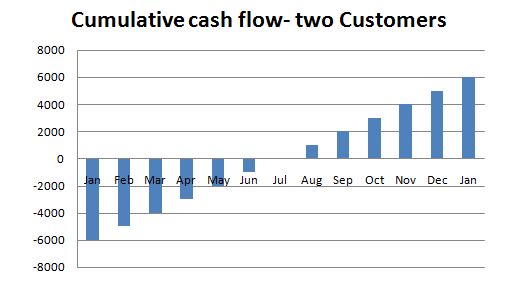
This trough gets deeper as you grow until there comes a time when you are making enough money off older users to fund new user acquisition, and you start turning a profit.
This is why in the initial stages, as your growth rate increases you need more investment to keep things afloat.
Now, there is one critical assumption in this model: there’s no churn.
This means that none of your two users have left you. In the real world that rarely happens. Some customers might quit after a few months, even before you had the chance to recoup your customer acquisition costs. When that happens, profitability gets impacted directly.
In our hypothetical startup let’s assume that one customer leaves after March. This is how the cash flow situation will look like
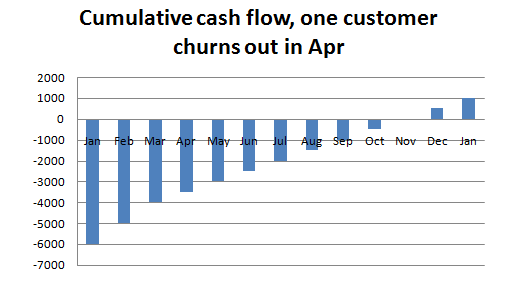
Notice how far back the breakeven point has been pushed?
It’s Nov instead of Jul now. This time period is called payback period, also defined as the amount of time required to recover CAC.
While your startup’s numbers will be infinitely more complicated there are three things you will still need to do in order to become as profitable as soon as possible.
1)Reduce cost of acquiring customers (CAC)
2)Increase the average life time value of a customer (LTV)
3)Slash revenue churn
To really get a handle on these numbers you need data, and you need formulas
But even before you start number crunching keep in mind two rules of thumb that have been validated across a wide range of startups.
1)LTV> 3*CAC
2)Payback period <12 months
Your customer life time value should be more than thrice the cost of acquiring customers, and you must recover your customer acquisition costs within a year.
Calculating vital SaaS metrics
Now that you have a bunch of guidelines and rules about calculating important startup metrics here’s how you should actually calculate them (Side Note: Once you are done with this post you should read this highly recommended essay on SaaS metrics by venture capitalist David Skok.)
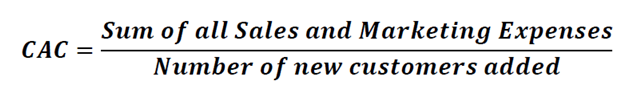
So, here’s how to calculate CAC
However as a marketer you will be more interested in specific channels as opposed to the overall CAC. The principle remains the same: you just have to isolate the spends on a particular channel against the number of customers acquired through that channel.
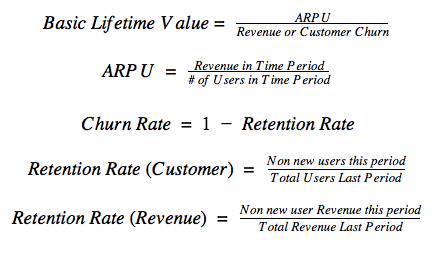
LTV and churn is closely linked, and they are in turn linked to another metric called ARPU (average revenue per user).
Here’s how all these metrics are related
Caveats and conclusion
Keep in mind one thing: none of the numbers that you would get from these formulas will be 100% accurate, because there’s no accurate way to measure all the inputs.
Take the CAC calculation, for instance. It’s easy to determine the marketing budget but the numerator will also include hundreds of hours put in by your colleagues. And no matter how many tools (e.g. Kissmetrics) you use to determine the last point of attribution, the number of customers per channel will never be accurate.
Take these numbers not in the absolute sense, and focus on the trends: monitor whether the CAC and churn rate is decreasing over time or whether the LTV is increasing.
The rest will sort itself out.


I will immediately clutch your rss feed as I can not find your e-mail subscription hyperlink or e-newsletter service. Do you’ve any? Kindly let me know in order that I may subscribe. Thanks.
https://www.smortergiremal.com/